R data loader to generate JPEG
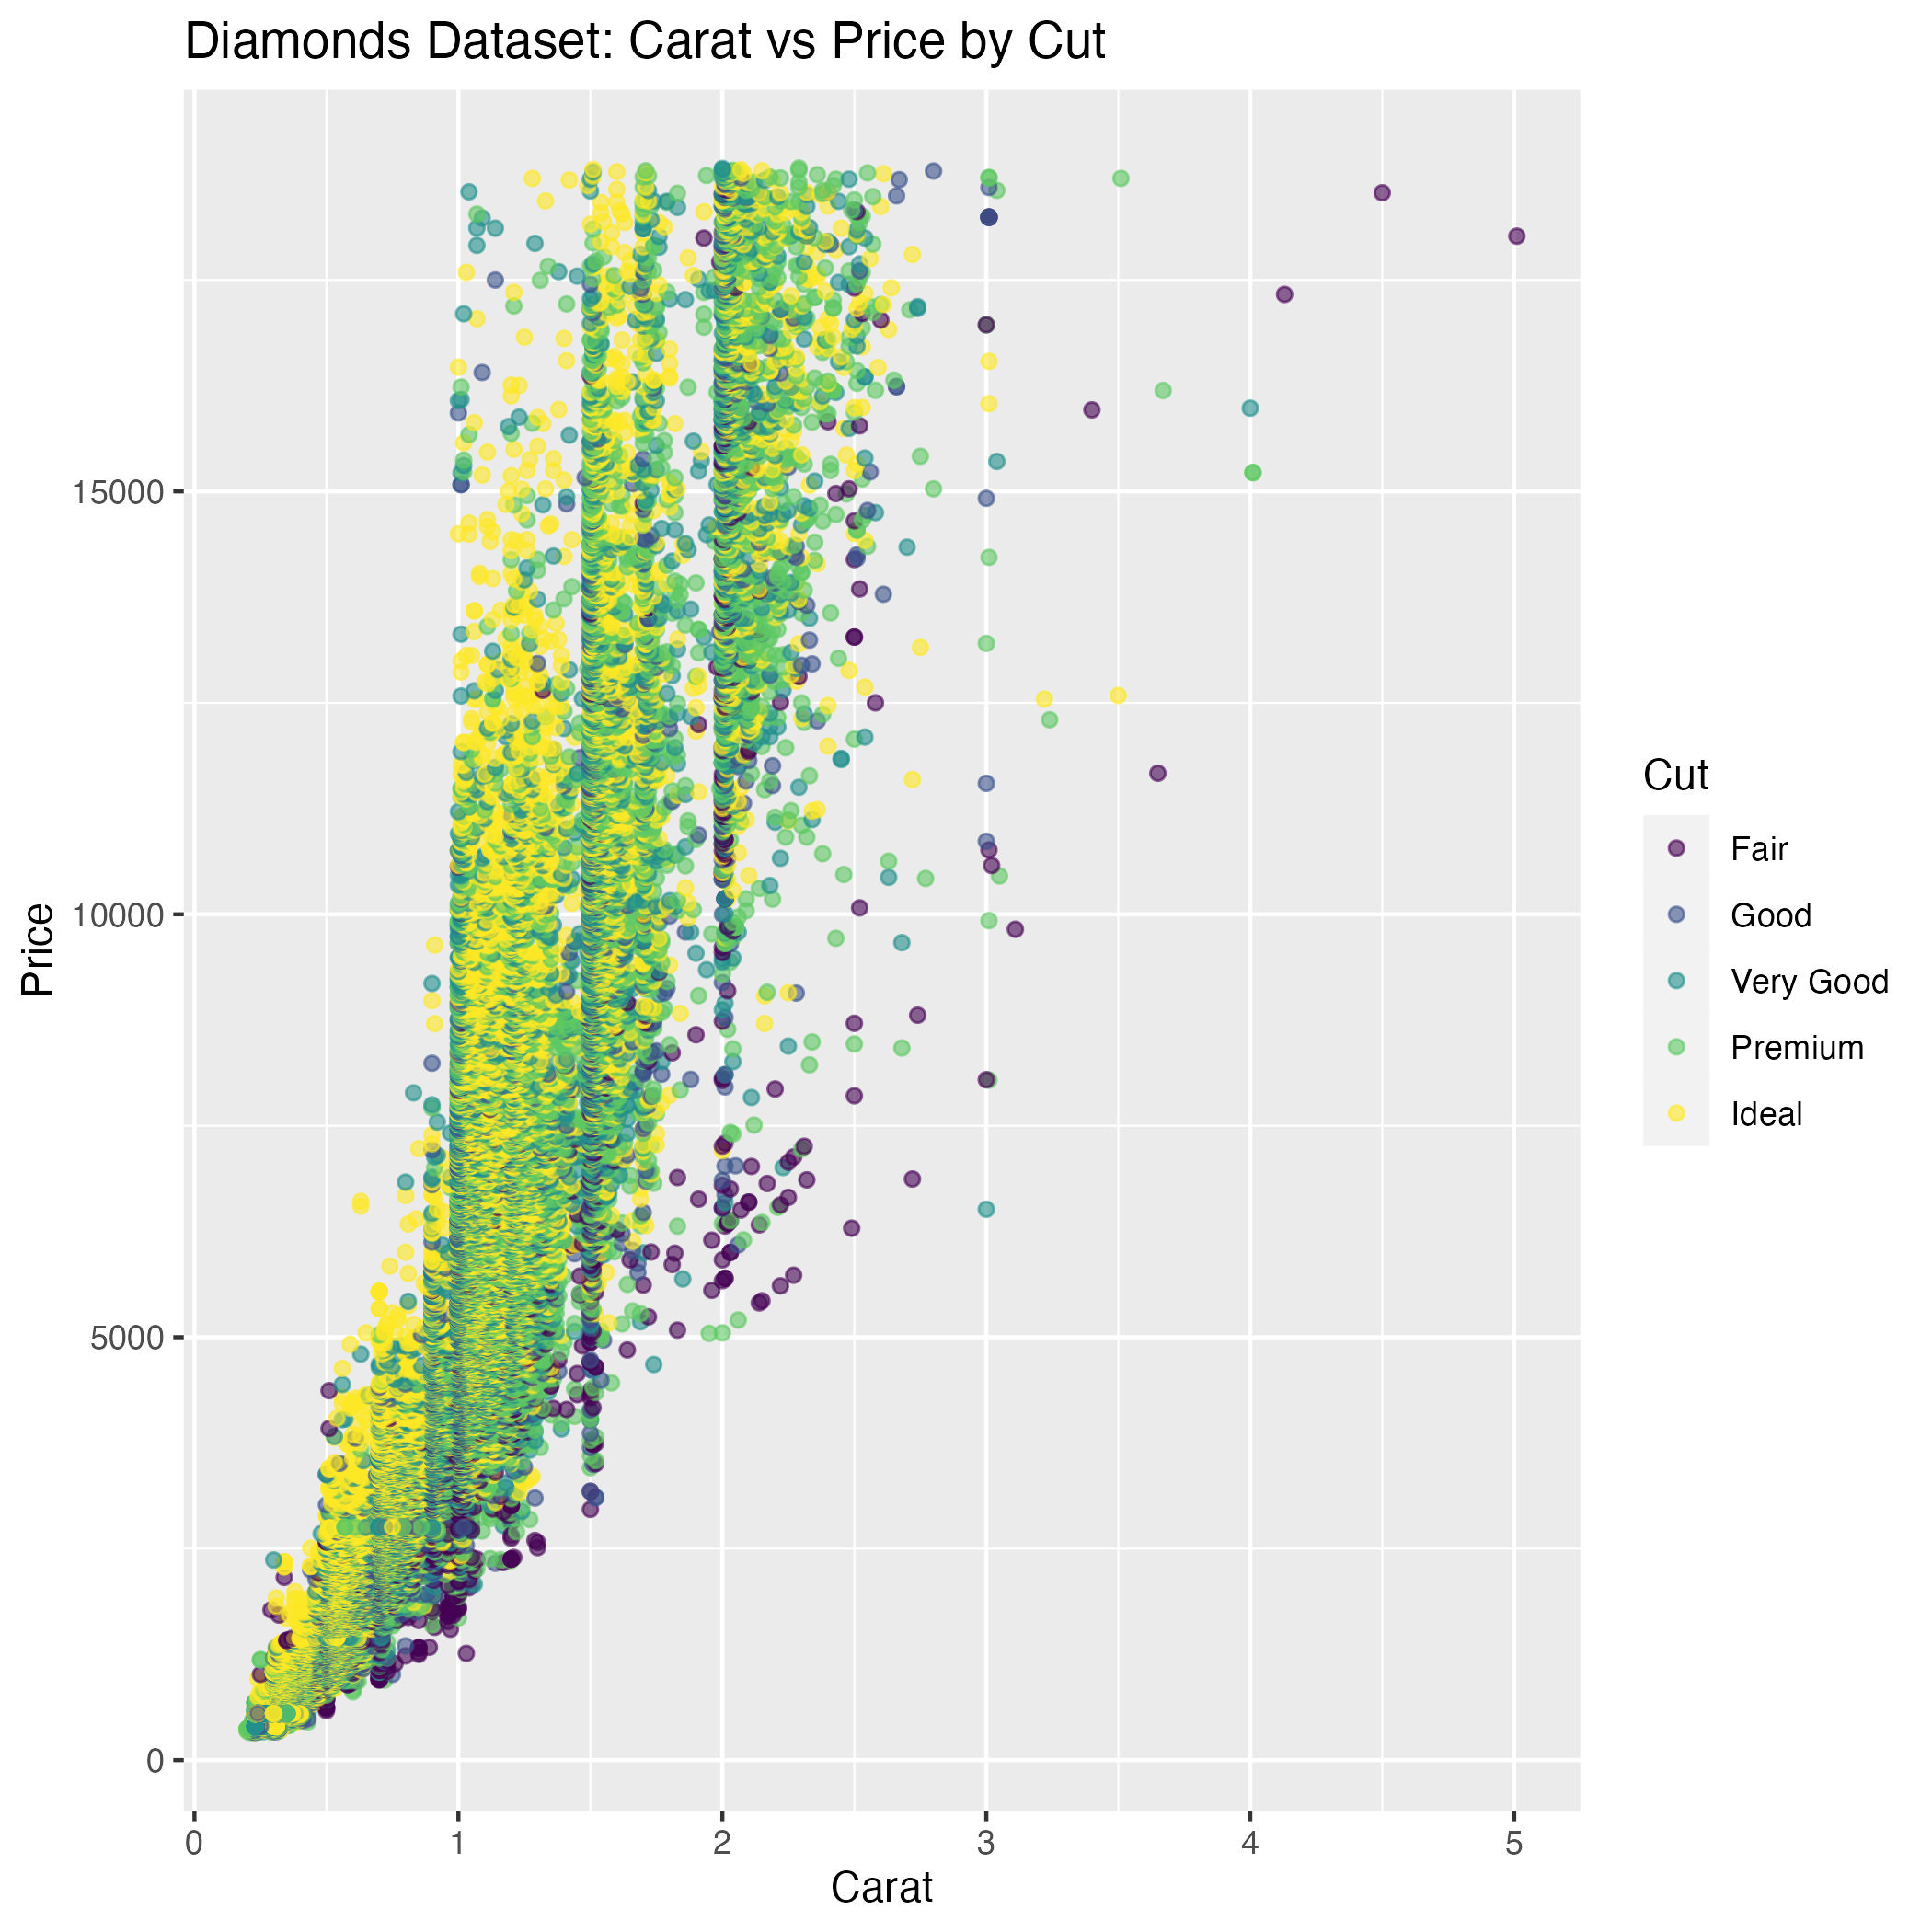
Here’s an R data loader that creates a scatterplot using ggplot2, then outputs the chart as JPEG to standard out. The scatterplot shows patterns for diamond price and clarity using the diamonds dataset, which is built into ggplot2 package.
# Load ggplot2
library(ggplot2)

# Create a scatterplot with built-in diamonds dataset
my_plot <- ggplot(diamonds, aes(x = carat, y = price, color = cut)) +
  geom_point(alpha = 0.6) +
  labs(
    title = "Diamonds Dataset: Carat vs Price by Cut",
    x = "Carat",
    y = "Price",
    color = "Cut"
  )

# Save as jpeg and write to standard output
ggsave(plot = my_plot, filename = "/dev/stdout", device = "jpeg")
To run this data loader, you’ll need R and the ggplot2 package installed, e.g. using install.packages("ggplot2").
The above data loader lives in data/diamonds.jpeg.R, so we can add the static image to our page using data/diamonds.jpeg:
<img src="data/diamonds.jpeg" style="max-width: 500px;">